During TE’s Annual Meeting in June, I shared that I enjoy looking at data as a way to orient myself. For the past decade, first when I was chair of TE’s membership committee and now as President, I like to look at as much membership data as possible to see how our community is shifting and to ensure I am thinking about our membership accurately.
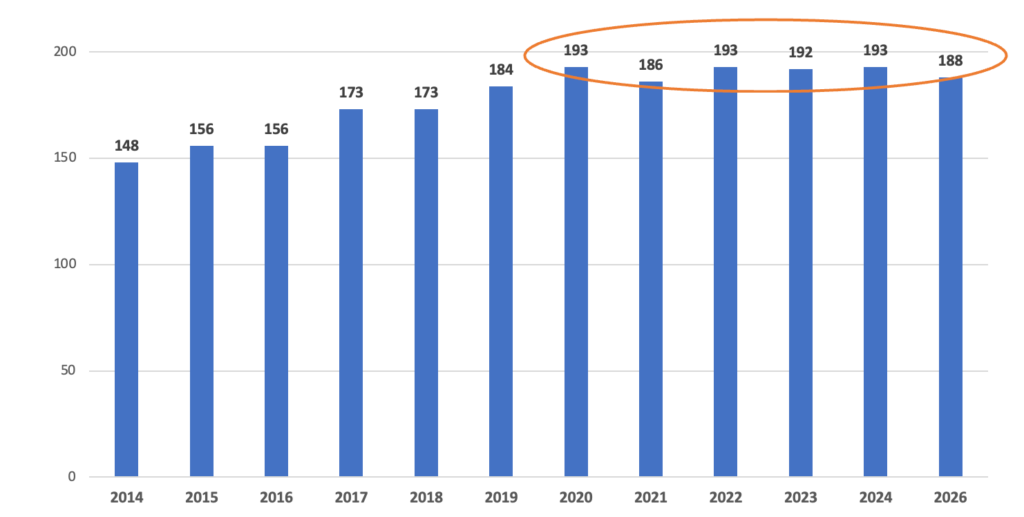
Our previous member database, Rakefet, shows that we have 188 family units at TE in 2026, up from 148 in 2014, which is the oldest data I could easily get my hands on. You will see that we have been very stable for the past six years after experiencing a nice membership growth for the six years prior. As many area temples are seeing declines right now, I am happy we are relatively flat, but I would of course love to see more new members joining TE in the year ahead.
TE Family Units (2014-2026)
Membership and Age Shifts (2014-2026)
Looking at our members by age has been helpful to see where our growth is coming from and also which age group is the majority of our community. This chart shows the total members each year, normalized to 100, so you can see how each age group evolved as a portion of the whole community. For example, 24% of our membership in 2014 was over the age of 70 and in 2026 that number is now 45%. Similarly 5% of our community was over the age of 80 in 2014 and that has now grown to 22%. Our older members, many of whom have been TE members for decades, are appropriately aging within TE. We as a community have to be mindful that as a whole, TE has more senior members.
But, interestingly, the split between those over and under 50 has not changed much in the past 12 years. Look at the line between gray and yellow, and yellow and blue in the chart below. We had 18% of our community under 49 in 2014, and today we have 20%. Looking at members below 59, we had 43% in 2014 and now have 37%. These shifts aren’t so meaningful, implying that for over a decade we have had more TE members over 60 then under 60 and that split is relatively unchanged. But, as a community its important that we are mindful that our more senior members are older than they were a decade ago (obviously 🙂) and we need to ensure we continue to bring in younger new members.
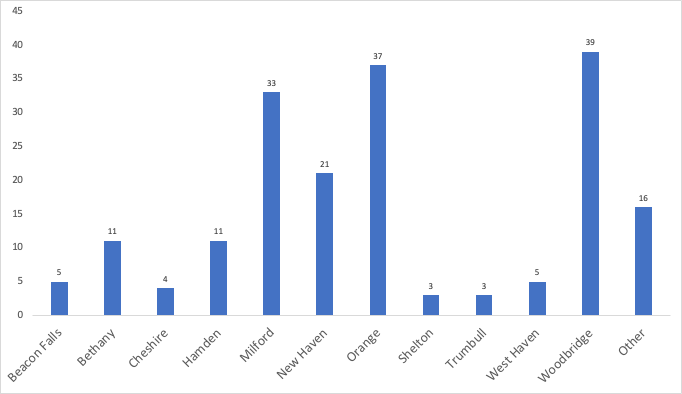
TE Members by Town (2026)
TE has always had high membership from Orange and Woodbridge but I thought it would be helpful to show all the towns where our members come from. I combined any towns with 2 or fewer families for ease of viewing, but I am happy to share the details if you are interested. When looking back a decade, Milford is the town that grew the most with TE members. In 2014 we had 17 family units from Milford and today we have 33. New Haven, Bethany and Hamden have all stayed pretty consistent since 2014.
We are shifting our office system from Rakefet to EasyShul in July. With this change I am excited to have more information to share to help us understand TE by the numbers, but more importantly this new system will make it much easier for our office and our community to communicate. EasyShul will have seamless billing, an online directory, easy event sign ups. It will also remove inefficient manual work from Sara and Lynn in the office.
You will receive an invite in early July to log into EasyShul for your 2026/2027 membership renewal and commitment form, as well as to validate and check that we have your right contact information.
Numbers and demographics about our membership is interesting and the administrative ease of EasyShul will help TE run smoother, but it only gets us so far. The most important piece of information that I can gather is directly from you. This past Spring we did a survey and I am so pleased to share that 120 surveys were completed. I shared some information about who completed the survey at the Annual Meeting and I am really pleased that the respondents appropriately represent our TE community.
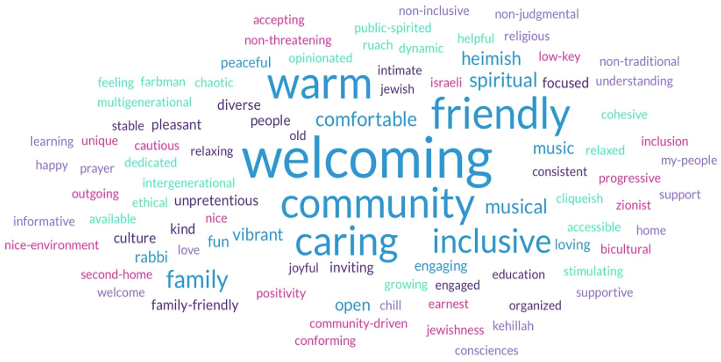
What three words would you use to describe TE
I will share more details from the survey soon but I couldn’t resist sharing this word cloud. One of the questions asked in the survey was “What Three Words Would You Use to Describe TE”. The size of the word in this image represents frequency of use. Our most used words to describe TE are: Welcoming, Warm, Friendly, Community, Care, Inclusive. I encourage you to review these words. Most are very positive, a few are critical. I appreciate this feedback and will spend time with the board this year keeping this word cloud in front of us to make sure we are being mindful of your feedback.
Please let me know if you have any questions on the information I shared here or at the Annual Meeting. Thank you for your feedback and keep it coming!